- [Vue.js] vue-chartjs에 datalabels 적용2024년 10월 10일 10시 49분 25초에 업로드 된 글입니다.작성자: DandyNow728x90반응형
1. vue-chartjs만으로는 data labels 표시할 수 없다!
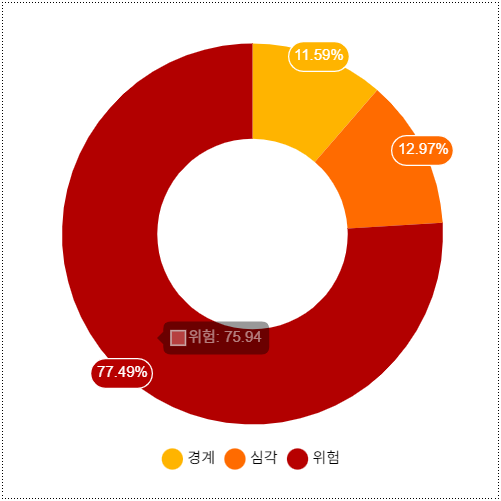
vue-chartjs로 렌더링 한 차트 영역에 값을 표시해야 했다. 그런데 "vue-chartjs" 라이브러리 만으로는 해결할 수 없었다. 추가로 "chartjs-plugin-datalabels" 라이브러리를 사용해야 한다. [그림 1]은 몇 번의 삽질 끝에 파낸 최종 결과물이다.

[그림 1] vue-chartjs로 그린 차트에 data labels 표시한 결과물 2. NPM 라이브러리 설치
2-1. vue-chartjs 설치
https://vue-chartjs.org/guide/#introduction
npm i vue-chartjs chart.js2-2. chartjs-plugin-datalabels 설치
https://chartjs-plugin-datalabels.netlify.app/guide/getting-started.html#installation
npm install chartjs-plugin-datalabels --save3. 차트 컴포넌트
ChartJS.register()의 인수로 ChartDataLabels를 추가하는 것이 중요한 포인트이다(plugin에 추가하는 오래된 방식으로 시도하다 많은 고생을 했다 ㅠ).
DoughnutChart.vue
<template>
  <Doughnut :data="data" :options="options" />
</template>

<script>
import { Chart as ChartJS, ArcElement, Tooltip, Legend } from 'chart.js'
import { Doughnut } from 'vue-chartjs'
import ChartDataLabels from 'chartjs-plugin-datalabels'
import { data, options } from './chartConfig.js'

ChartJS.register(ArcElement, Tooltip, Legend, ChartDataLabels)

export default {
  name: 'DoughnutChart',
  components: { Doughnut },
  mounted() {
    console.log(data)
  },
  data() {
    return {
      data,
      options
    }
  }
}
</script>
chartConfig.js
데이터와 옵션이 정의된 파일이다.
export const data = {
  labels: ['VueJs', 'EmberJs', 'ReactJs', 'AngularJs'],
  datasets: [
    {
      backgroundColor: ['#41B883', '#E46651', '#00D8FF', '#DD1B16'],
      data: [40, 20, 80, 10]
    }
  ]
}

export const options = {
  responsive: true,
  maintainAspectRatio: false,
  plugins: {
    datalabels: {
      anchor: 'end',
      backgroundColor: function (context) {
        return context.dataset.backgroundColor
      },
      borderColor: 'white',
      borderRadius: 30,
      borderWidth: 1,
      color: function (context) {
        return context.hovered ? 'black' : 'white'
      },
      font: {
        weight: 'normal'
      },
      listeners: {
        enter: function (context) {
          context.hovered = true
          return true
        },
        leave: function (context) {
          context.hovered = false
          return true
        }
      },
      display: true,
      formatter: function (value, context) {
        let sum = 0
        const valueArr = data.datasets[0].data
        for (const i in valueArr) {
          sum += parseInt(valueArr[i])
        }
        const percentage = ((value * 100) / sum).toFixed(2) + '%'
        return percentage
      }
    }
  }
}
4. 참고 자료
- Vue Chartjs 공식 문서의 예제 : https://stackblitz.com/github/apertureless/vue-chartjs/tree/main/sandboxes/doughnut?file=index.ts
- data labels 스타일 참조한 블로그 : https://devhealer.tistory.com/2
2024-10-11 추가
5. 데이터가 0인 경우 처리
datalabels 속성을 추가한 결과물에서 데이터가 0인 경우 차트에서 차지하는 영역이 없으므로 굳이 0을 표시할 필요가 없다고 생각했다. display 속성이 true인 경우 data label을 표시하므로 0인 경우는 display가 false가 되도록 하면 된다. 차트 내 각각의 데이터는 배열 구조로 되어 있고 context.dataset.data 속성에 들어 있다. 각 영역(바차트의 경우 개별 막대)은 context.dataIndex라는 인덱스를 가지고 있다. 따라서 context.dataset.data 배열에서 context.dataIndex에 해당하는 값이 0이 아닌 경우 true 처리하면 값이 있는 경우에만 data label을 표시할 수 있다.
display: (context) => context.dataset.data[context.dataIndex] && true6. 차트의 일부가 잘리는 경우
차트 영역 내에서 데이터 레이블이 일부 잘리는 현상이 발생했다([그림 2] 오른쪽 상단 참조).

[그림 2] 오른쪽 상단 데이터 레이블 일부가 잘렸다. 차트 옵션 객체에 아래와 같이 layout 속성을 추가하면 해결할 수 있다.
layout: {
  padding: {
    top: 20,
    bottom: 20,
    left: 20,
    right: 20
  }
},
[그림 3]은 위 속성을 추가한 결과이다.

[그림 3] layout 속성을 추가한 결과물 728x90반응형'언어·프레임워크 > Vue.js' 카테고리의 다른 글
[Vue.js] 옵션(Options) 방식: 데이터 변경에 따른 리렌더링 완벽 가이드 (0) 2025.07.03 [Vue.js] 환경 변수 관리(.env): `--mode` 옵션으로 깔끔하게 해결하는 법 (1) 2025.06.23 [Vue.js] 카운트다운 서클 타이머 버튼 만들기 (0) 2024.10.04 [Vue.js] Bootstrap Autoplaying Carousel 오작동 문제 (0) 2024.09.27 [Vue.js] watch로 두개 이상의 값 변경 감지 (0) 2024.09.25 다음글이 없습니다.이전글이 없습니다.댓글