[Vue.js] vue-chartjs를 이용해 "누적 막대 차트" 구현
vue-chartjs로 "누적 막대형 차트(Stacked Bar Chart)" 구현
Vue.js 3에서 누적 막대형 차트를 구현하고자 하였다. 여러 라이브러리 중에서 vue-chartjs가 가장 무난해 보여 선택했다.
https://vue-chartjs.org/guide/
Getting Started | 📈 vue-chartjs
Getting Started vue-chartjs is a wrapper for Chart.js in vue. You can easily create reuseable chart components. Supports Chart.js v3. Introduction vue-chartjs lets you use Chart.js without much hassle inside Vue. It's perfect for people who need simple cha
vue-chartjs.org
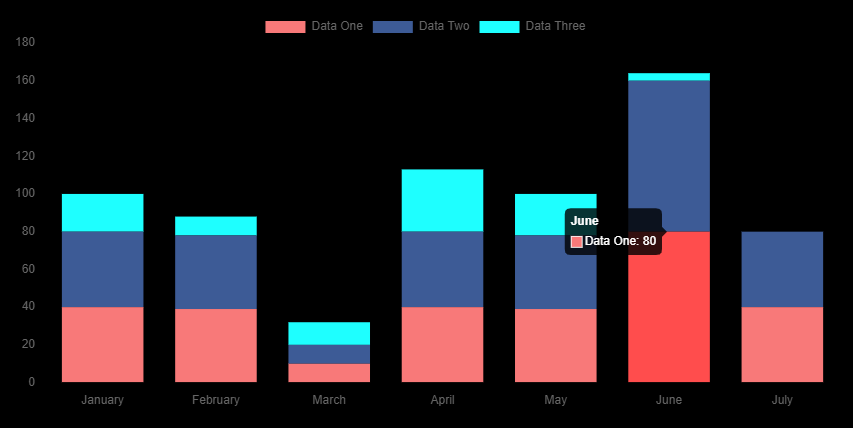
공식문서에서 기본 막대형 차트는 쉽게 찾아볼 수 있었으나 누적 막대형 차트에 대한 설명은 찾을 수 없었다. Examples에서 Bar 예제 코드를 띄우고 이런저런 테스트 끝에 원하는 "누적 막대형 차트"를 구현할 수 있었다.
vue-chartjs-bar-example - CodeSandbox
vue-chartjs-bar-example using chart.js, typescript, vue, vue-chartjs
codesandbox.io
핵심적인 코드는 "chartOptions"의 "scales"였다. x, y의 stacked가 반드시 객체 형태이어야 한다(배열 내 객체이면 작동하지 않는다).
chartOptions: {
    responsive: true,
    maintainAspectRatio: false,
    // 아래 코드가 누적 막대 차트를 만드는 핵심 설정이다.
    scales: {
        x: {
        	stacked: true
        },
        y: {
        	stacked: true
        }
    }
}
전체 코드
// views
<template>
  <div>
    <div class="m-4 p-5 content-area">
      <h3>누적 막대 차트</h3>
      <BarChart :chart-data="chartData" :chart-options="chartOptions" />
      <div
        class="list-group list-group-checkable d-grid gap-2 border-0 w-auto"
      ></div>
    </div>
  </div>
</template>
<script>
import BarChart from '../components/BarChart'
import {
  Chart as ChartJS,
  Title,
  Tooltip,
  Legend,
  BarElement,
  CategoryScale,
  LinearScale
} from 'chart.js'
ChartJS.register(Title, Tooltip, Legend, BarElement, CategoryScale, LinearScale)
export default {
  components: { BarChart },
  data() {
    return {
      chartData: {
        labels: [
          'January',
          'February',
          'March',
          'April',
          'May',
          'June',
          'July'
        ],
        datasets: [
          {
            label: 'Data One',
            backgroundColor: '#f87979',
            data: [40, 39, 10, 40, 39, 80, 40]
          },
          {
            label: 'Data Two',
            backgroundColor: '#3D5B96',
            data: [40, 39, 10, 40, 39, 80, 40]
          },
          {
            label: 'Data Three',
            backgroundColor: '#1EFFFF',
            data: [20, 10, 12, 33, 22, 4, 0]
          }
        ]
      },
      chartOptions: {
        responsive: true,
        maintainAspectRatio: false,
        scales: {
          x: {
            stacked: true
          },
          y: {
            stacked: true
          }
        }
      }
    }
  },
  setup() {},
  created() {},
  mounted() {},
  unmounted() {},
  methods: {}
}
</script>
// BarChart.vue
<template>
<Bar
:chart-options="chartOptions"
:chart-data="chartData"
:chart-id="chartId"
:dataset-id-key="datasetIdKey"
:plugins="plugins"
:css-classes="cssClasses"
:styles="styles"
:width="width"
:height="height"
/>
</template>
<script>
import { Bar } from 'vue-chartjs'
import {
Chart as ChartJS,
Title,
Tooltip,
Legend,
BarElement,
CategoryScale,
LinearScale
} from 'chart.js'
ChartJS.register(Title, Tooltip, Legend, BarElement, CategoryScale, LinearScale)
export default {
name: 'BarChart',
components: { Bar },
props: {
chartId: {
type: String,
default: 'bar-chart'
},
datasetIdKey: {
type: String,
default: 'label'
},
width: {
type: Number,
default: 400
},
height: {
type: Number,
default: 400
},
cssClasses: {
default: '',
type: String
},
styles: {
type: Object,
default: () => {}
},
plugins: {
type: Object,
default: () => {}
}
},
data() {
return {}
}
}
</script>